Haskellでグラフ描画

30分プログラム、その406。Data.Graph.Inductive.Graphvizというおもしろそうなライブラリを見つけたので使ってみる。
要するにノードとエッジで構成された、いわゆるグラフ理論のほうのグラフを扱うためのライブラリらしい。
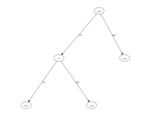
ノードとエッジでグラフを作るのは柔軟なんだけど扱いが面倒なので、二分木からグラフへの変換を行なう関数を作ってみた。その際、各ノードにidを振る必要があったのでStateモナドを使ってみた。もしかしたら初Stateモナドかもしれない。
使い方
*Main> let tree = Branch "root" (Branch "a" Leaf Leaf) Leaf

*Main> putStrLn $ graphviz' $ fromTree tree
digraph fgl {
	margin = "0"
	page = "8.5,11.0"
	size = "11.0,8.5"
	rotate = "90"
	ratio = "fill"
	0 [label = "Leaf"]
	1 [label = "Leaf"]
	2 [label = "\"a\""]
	3 [label = "Leaf"]
	4 [label = "\"root\""]
	2 -> 1 [label = "right"]
	2 -> 0 [label = "left"]
	4 -> 3 [label = "right"]
	4 -> 2 [label = "left"]
}
ソースコード
import Control.Monad.State
import Data.Graph.Inductive.Graph
import Data.Graph.Inductive.Graphviz
import Data.Graph.Inductive.Tree

data Tree a = Branch a (Tree a) (Tree a) | Leaf

mkNode :: Show a => a -> State Int (LNode a)
mkNode name = do id <- get
                 put (id+1)
                 return (id,name)

graph :: Show a => Tree a -> State Int (Node,[LNode String],[LEdge String])
graph Leaf = do lnode@(node,_) <- mkNode "Leaf"
                return (node,[lnode],[])

graph (Branch label l r) = do (left ,nodes1,edges1) <- graph l
                              (right,nodes2,edges2) <- graph r
                              lnode@(node,_)        <- mkNode $ show label
                              let edges3 = [(node,left,"left"),(node,right,"right")]
                              return (node,[lnode] ++ nodes1 ++ nodes2,edges1 ++ edges2 ++ edges3)

fromTree :: Show a => Tree a -> Gr String String
fromTree tree = let (_,nodes,edges) = fst $ runState (graph tree) 0 in
                mkGraph nodes edges

sample = graphviz' $ fromTree tree
    where tree = Branch "root" (Branch "a" Leaf Leaf) Leaf